On a pulse device, it will spike when a hit is found. But you can't watch it because eye movement can cause an elevated heart rate and make it spike.
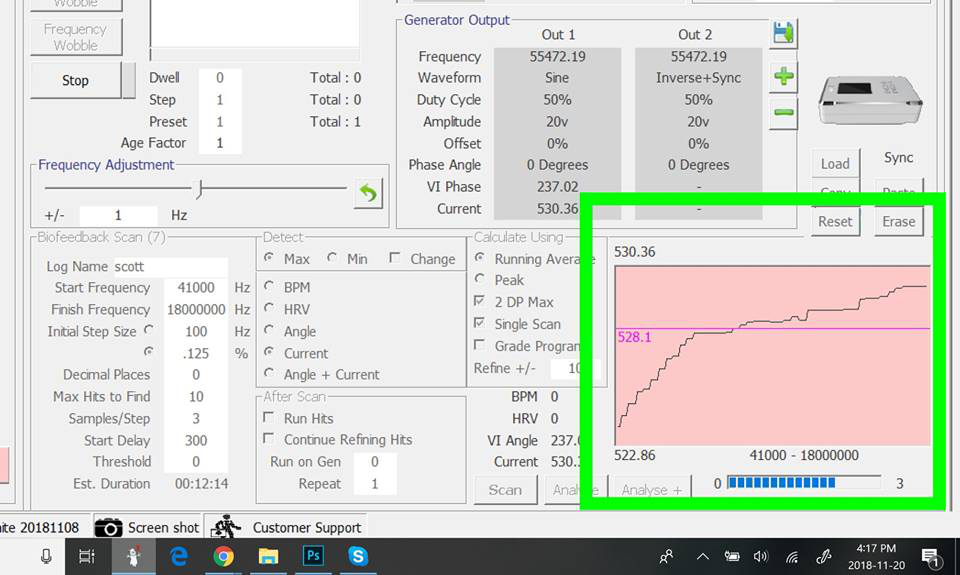
On GX scan, I do not think its useful. Not sure it means anything. I do not know a way to see the whole chart.
You can get the data and graph it if you want, but really not much use.
For more details, please check this link:
https://www.facebook.com/groups/spooky2/permalink/1145745575587344/
Comments
Please sign in to leave a comment.